 Johnattan's Laboratory
Brazil spends more on health. Why do Brazilians pay more of it themselves?
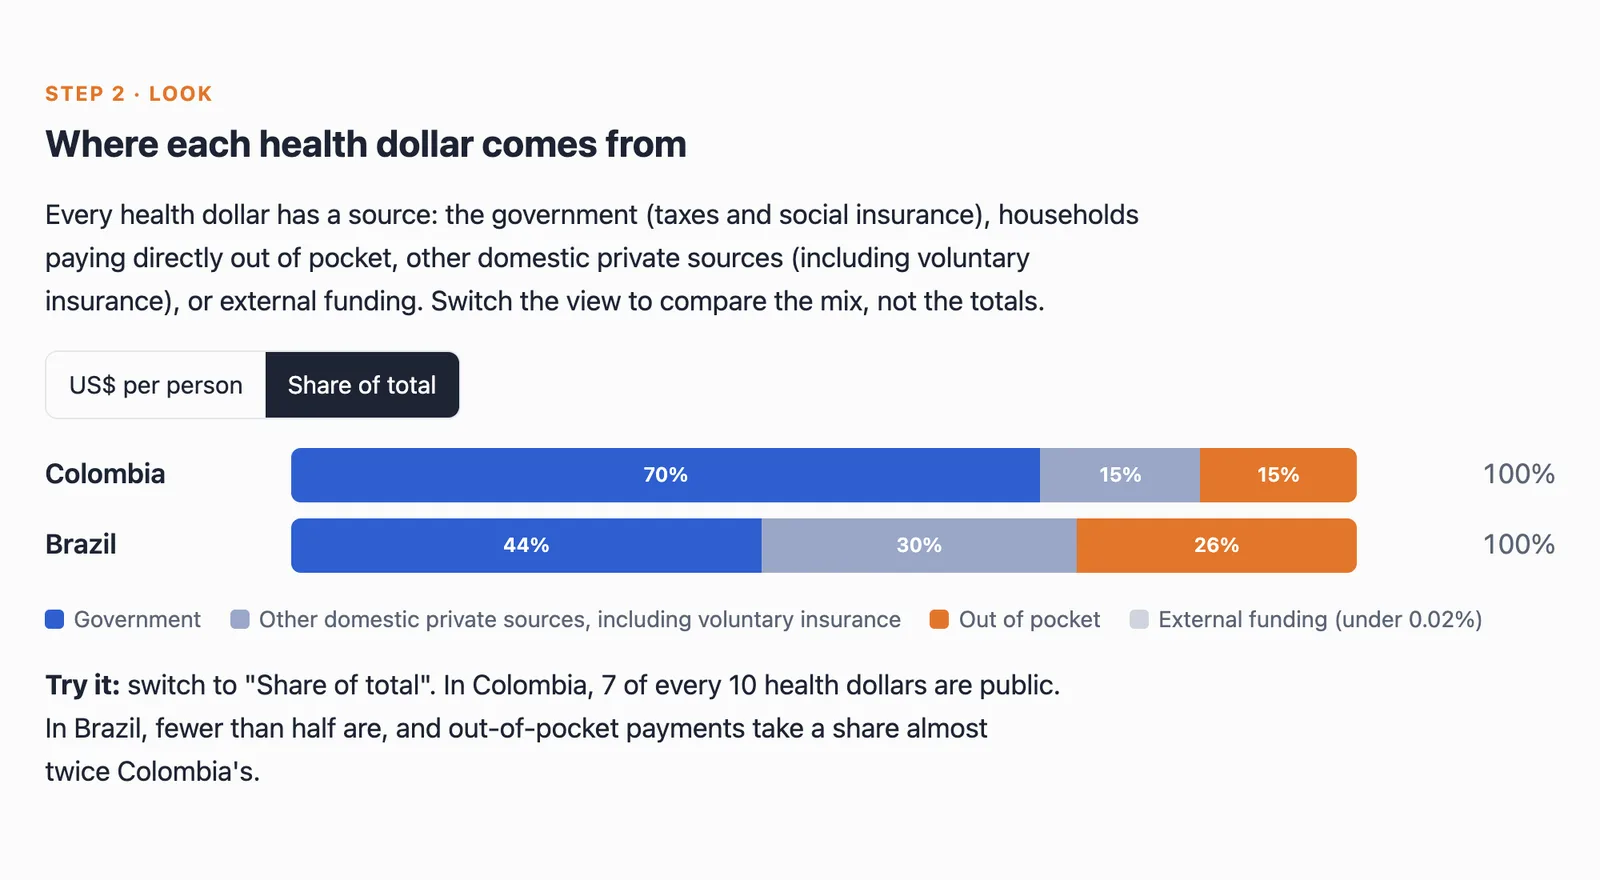
Out-of-pocket payments are 26% of Brazil's health spending and 15% of Colombia's. I traced where the gap sits in the health accounts and built an explainer around it.
Updated5 Oct 2026
The problem
I wanted to compare Colombia and Brazil, two very different health systems, across everything the WHO measures. The WHO's Global Health Observatory has 3,099 indicators, and finding the ones both countries report for the same year means writing code.
What was out there
The WHO's portals show one indicator at a time. Nothing lines up two countries across all of them, says which comparisons are fair, or explains the gaps it finds.
What I built
A comparison of 115 indicators and an interactive explainer on one of its biggest surprises: if both governments spend about the same on health per person, Brazil's extra spending must come from households and other private sources, not from the state.
Equipment
- WHO Global Health Observatory Data sources
- WHO Global Health Expenditure Database Data sources
- WHO GHED MCP MCP servers
- Python and uv Code and infrastructure
- Claude Code Harnesses and agents
- Claude (Opus 4.6 to 5.5) AI models
- Codex CLI Harnesses and agents
- GPT (GPT-5.5 to GPT-6.1 in Codex) AI models
How I built it
- Scanned all 3,099 Global Health Observatory indicators for the ones with data for both countries.
- Cut the list to 115 comparable indicators, writing down the reason for every cut.
- Took health financing as the first story and rebuilt each country's health dollar by source, per person, for 2023.
- Built an interactive explainer with a policy slider and self-tests, had a second AI model review it, and fixed what it found.
3,099 indicators in, 115 out
Results
Out-of-pocket payments, share of current health spending
Percent, 2000 to 2023
Brazil's share has fallen from 36.6% in 2000 to 26.2% in 2023. Colombia's has stayed between 8.6% and 20.9% the whole time. The gap is not public money: government health spending per person in 2023 was US$446 in Brazil and US$402 in Colombia.
Source: WHO Global Health Expenditure Database, update of April 2026. Colombia's 2024 value is preliminary and Brazil has none yet, so the chart stops at 2023.
What I learned
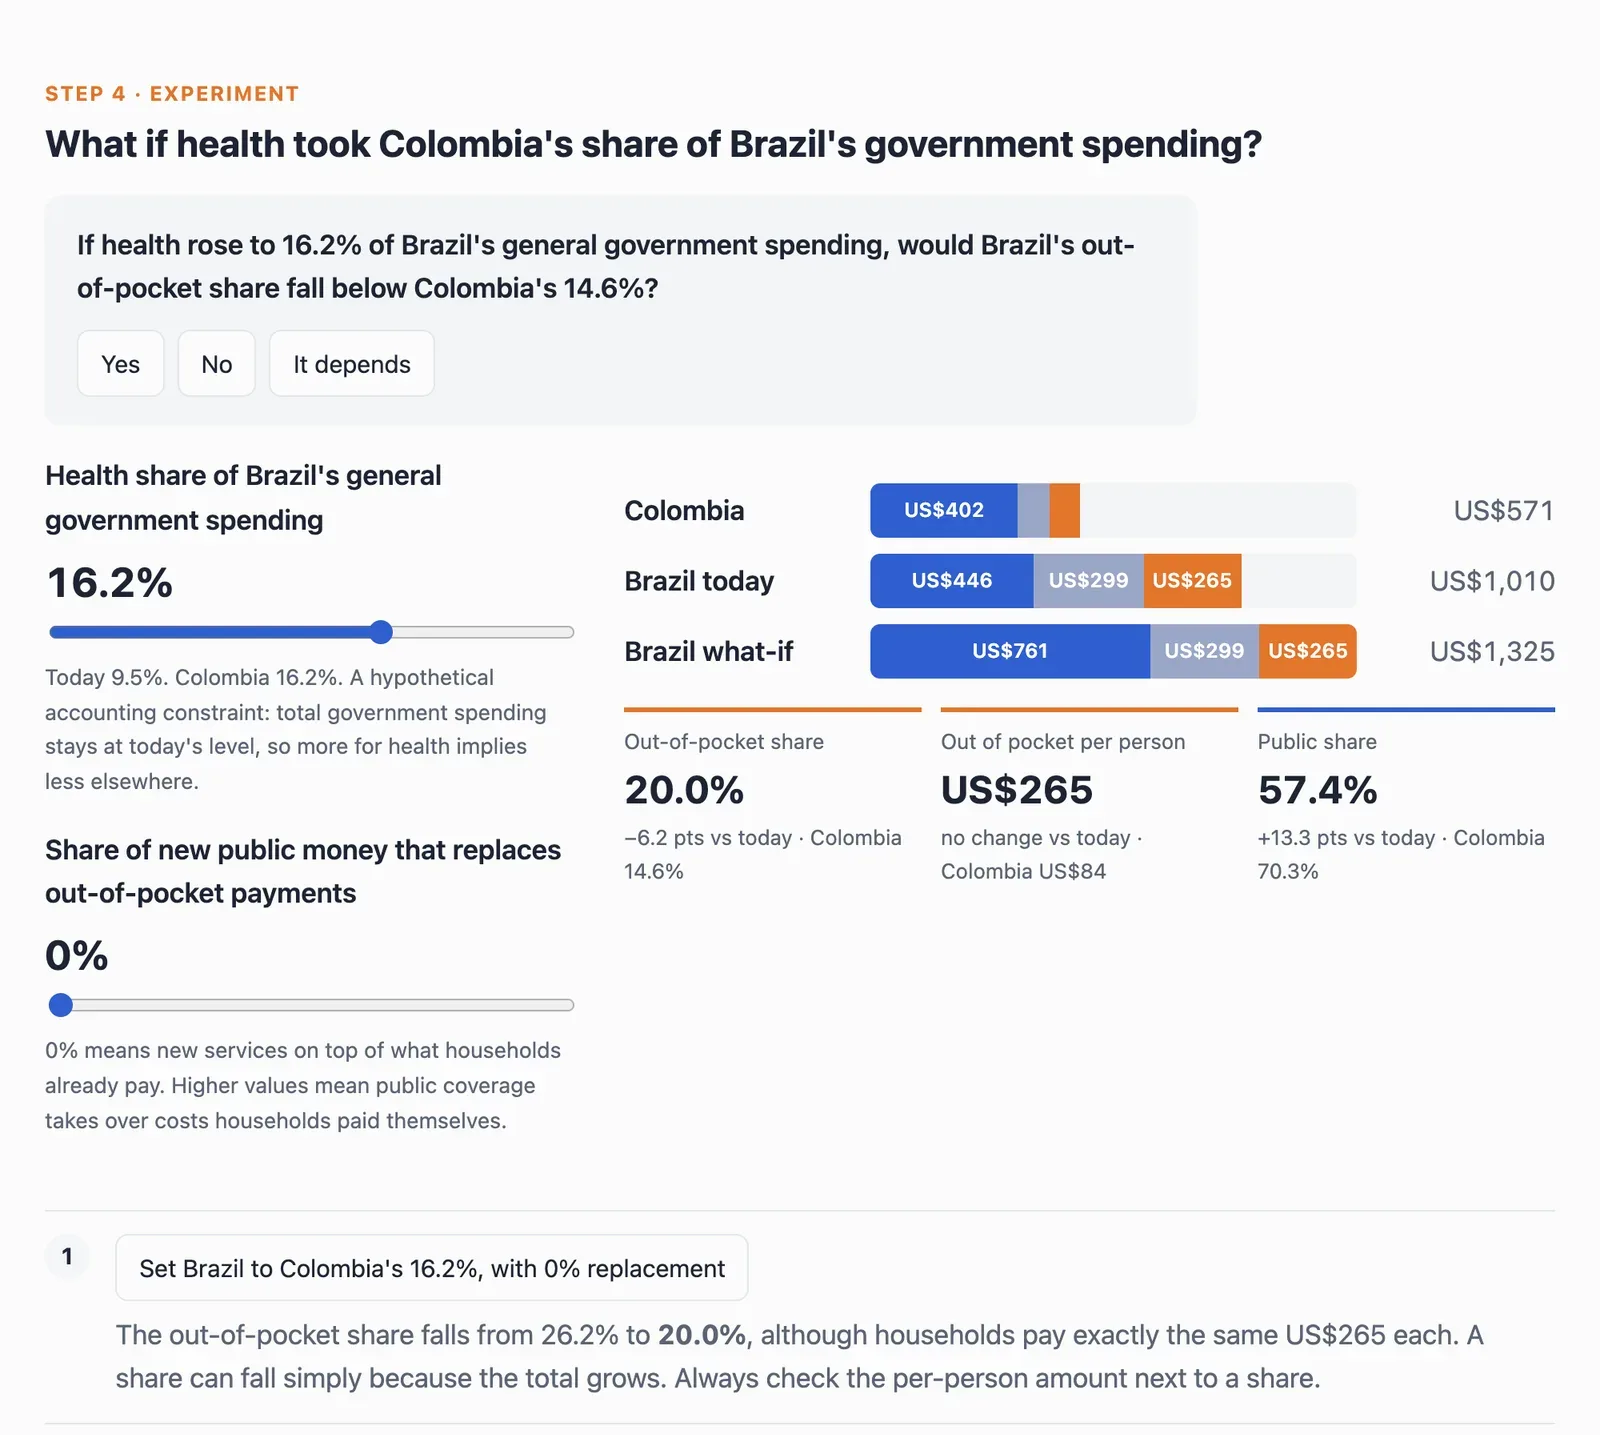
A share can fall even when households pay exactly the same, because the total grows. Always check the per-person amount next to a share.
Most indicators could not be compared at all: the two countries often report different latest years, so of 3,099 indicators only 1,414 shared one.
Lab notes
-
I wrote it up for the lab, with the WHO GHED series from 2000 to 2023 and a year scrubber you can drag.
-
I built an interactive explainer on health financing with a policy slider and 18 self-tests, and fixed everything an independent Codex review found.
-
I scanned all 3,099 WHO Global Health Observatory indicators for the ones Colombia and Brazil both report, and trimmed them to 115 comparable ones, with a written reason for every cut.