 Johnattan's Laboratory
Falling births are hiding part of the fall in Colombia's child mortality
Colombia's under-five mortality rate divides deaths by births, and births are falling fast. I rebuilt the series from 2008 to the preliminary 2025 figure to separate fewer deaths from a shrinking denominator, and tested whether child deaths from malnutrition changed trend.

Updated22 Feb 2026
The problem
Colombia reports under-five mortality as deaths of children aged 0 to 4 divided by the births of the same year. Births are falling quickly, so the rate can move even when deaths do not. When the government's preliminary 2025 figure showed a sharp drop, I wanted to know how much of it was fewer children dying and how much was fewer children being born.
What I built
A small set of Python scripts and a Jupyter notebook, in Spanish, built on DANE (Colombia's national statistics office) vital statistics. They compare the reported rate with a standardized one, test how sensitive the 2025 rate is to the still preliminary birth count, and run a joinpoint regression on deaths from malnutrition.
Equipment
- Python and uv Code and infrastructure
- Jupyter Notebook Code and infrastructure
- DANE Data sources
How I built it
- Built the series of births and under-five deaths from 2008 to 2024, plus the preliminary 2025 figure of 440,571 births and 5,255 deaths.
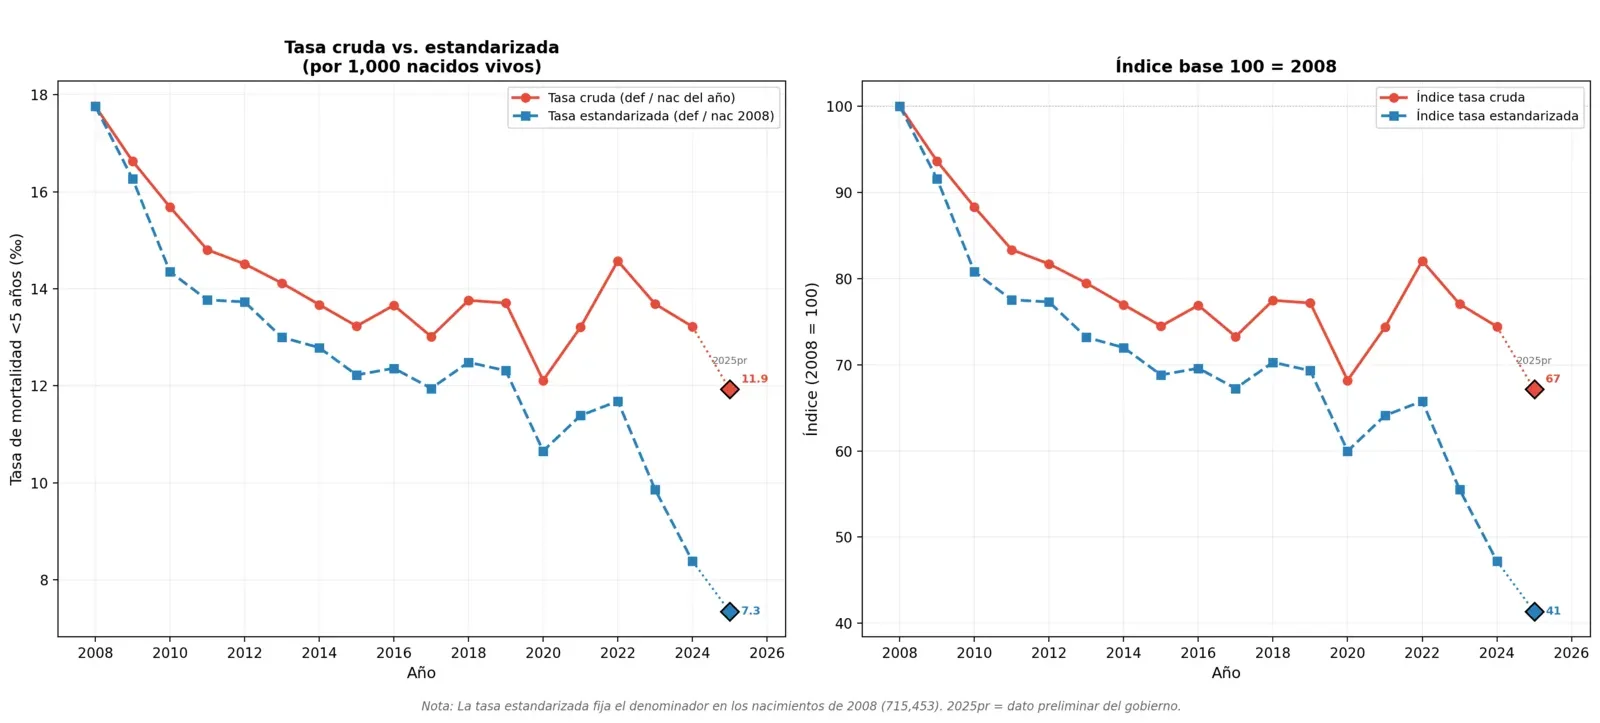
- Computed the reported (crude) rate and a standardized rate that keeps the 2008 births (715,453) as the denominator, so the standardized line moves only when deaths move.
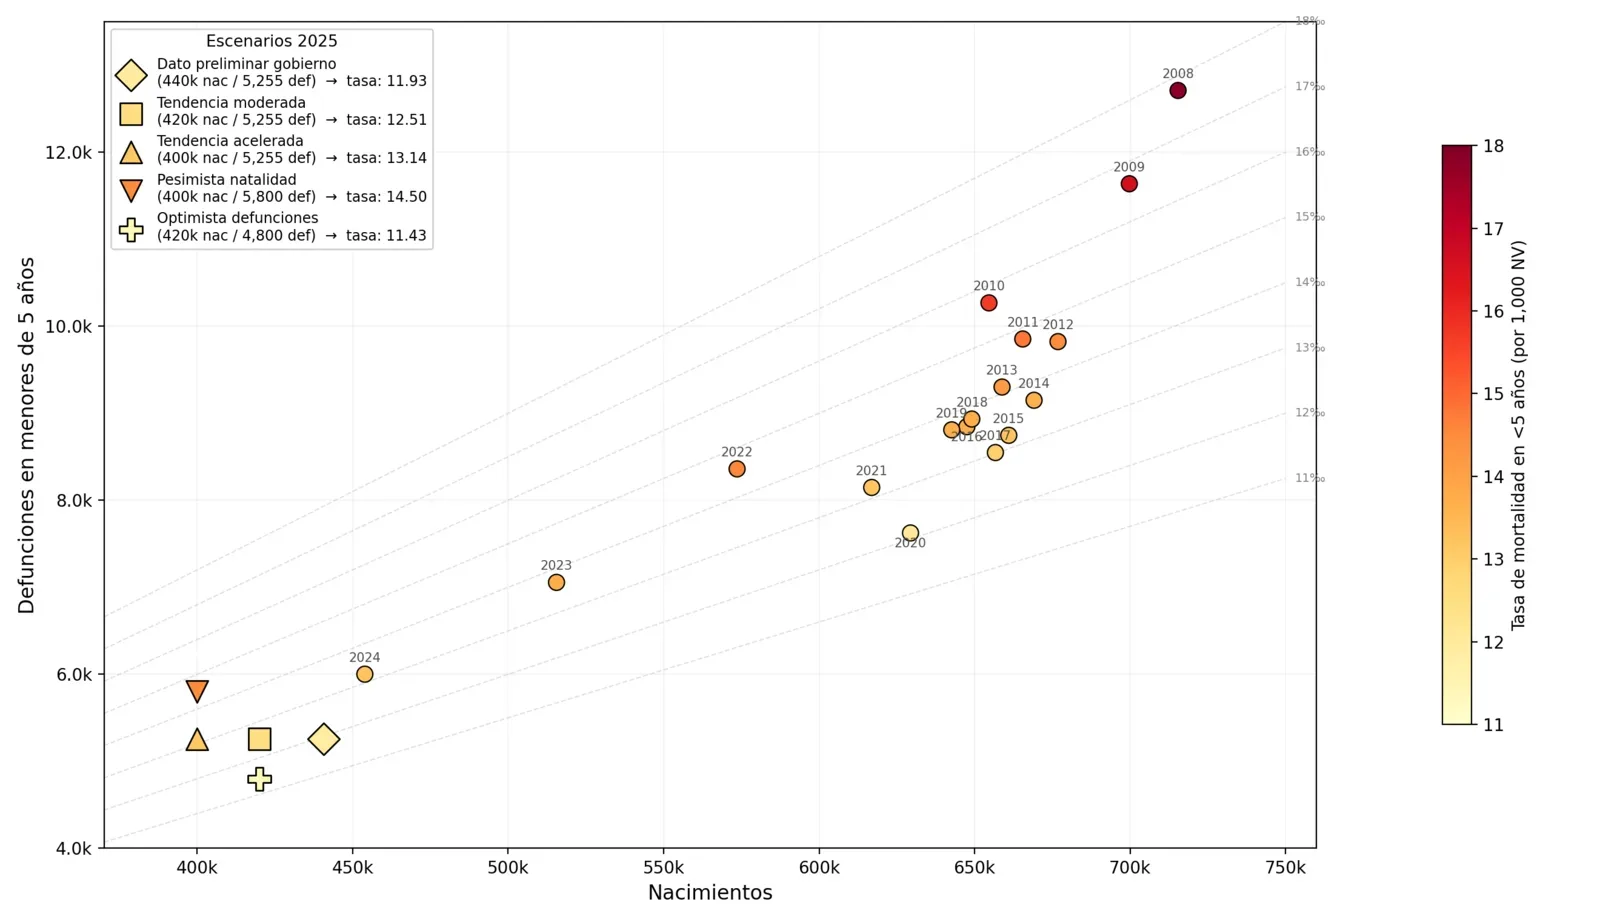
- Recomputed the 2025 rate under four alternative assumptions for births and deaths, and drew them against lines of equal rate.
- Compared the same-year births denominator with the five birth cohorts actually at risk in 2025.
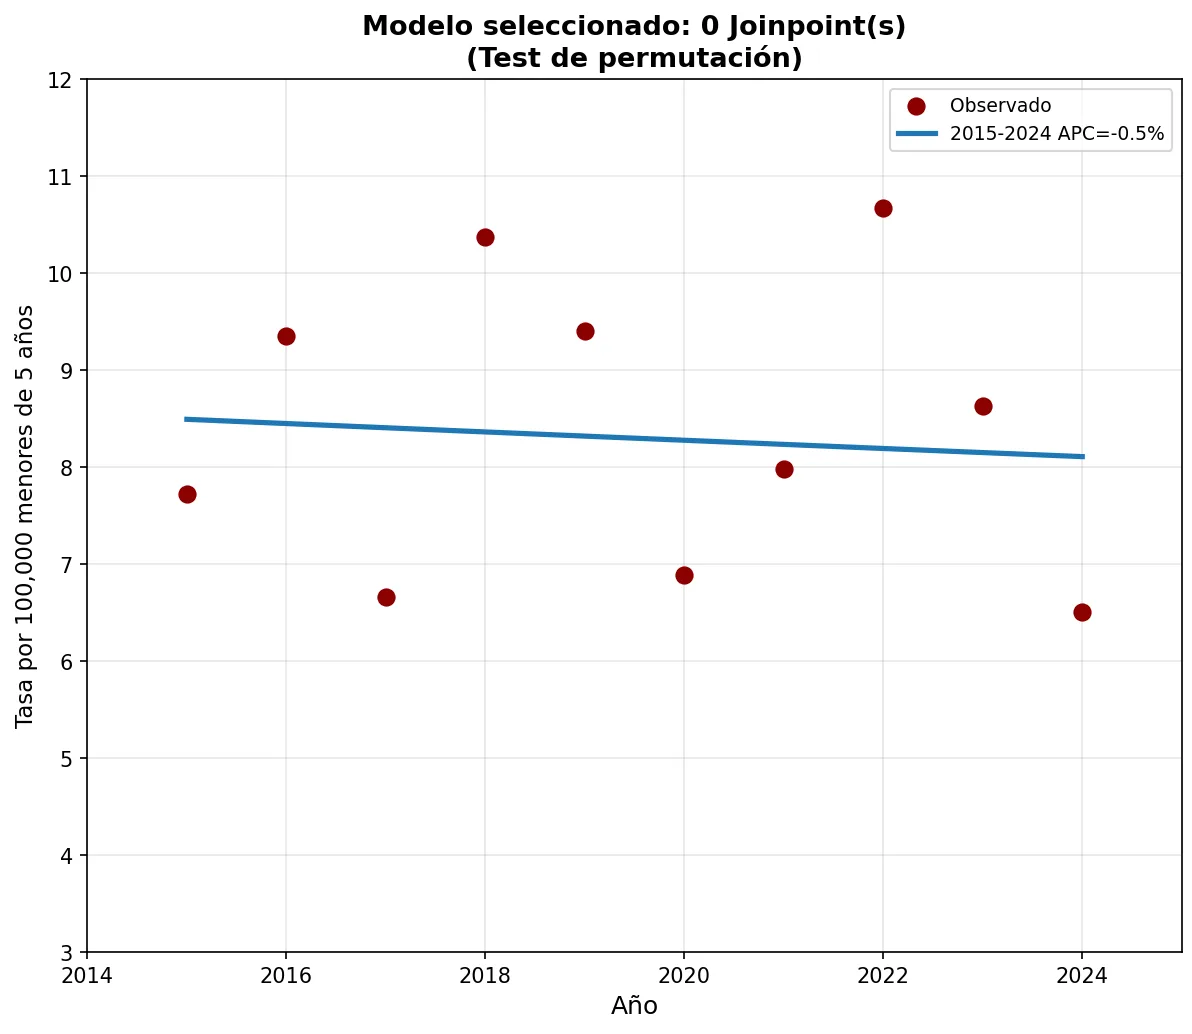
- Fitted joinpoint models (log-linear segments, as in the US National Cancer Institute's Joinpoint software) to malnutrition deaths per 100,000 children under five, 2015 to 2024, and compared the model the permutation test selects with a simpler one-joinpoint model.
Results
- Births fell from 715,453 in 2008 to 453,901 in 2024 (down 36.6 percent). Under-five deaths fell from 12,709 to 6,001 (down 52.8 percent).
- The reported rate fell from 17.8 per 1,000 live births in 2008 to 11.9 in the preliminary 2025 figure, a drop of 33 percent. With the denominator fixed at 2008 births, it fell to 7.3, a drop of 59 percent.
- From 2024 to the preliminary 2025 figure, deaths fell 12.4 percent but births only 2.9 percent, after falls of 7.0, 10.1 and 12.0 percent in the three previous years. So the reported rate fell 9.8 percent in one year, a figure that rests on a birth count that is still preliminary.
- If 2025 births come in at 420,000 instead of 440,571, the rate is 12.51; at 400,000 it is 13.14.
- Dividing 2025 deaths by the average of the five cohorts born from 2021 to 2025 (520,112) gives 10.10 per 1,000 instead of 11.93.
- For deaths from malnutrition, the permutation test kept zero joinpoints (p = 0.6176 against one): a flat trend of minus 0.51 percent a year from 2015 to 2024, not significant (p = 0.8123). The one-joinpoint model puts the break at 2021 to 2022 and a fall of 21.90 percent a year from 2022 to 2024, but that segment has three points and p = 0.0511. Over 2008 to 2024 the trend is minus 1.29 percent a year (p = 0.1688).
What I learned
Check the denominator before reading a rate. With births falling this fast, deaths divided by same-year births is a weak proxy for the probability of dying before age five. Here the standardized rate shows a larger improvement than the reported one.
This ten-point series did not give enough evidence for a trend break. The permutation test chose no joinpoint, while the information criterion chose three; a three-point segment that just misses significance is not evidence of a new trend.
The population denominators are the weak spot. The DANE projection file in the folder jumps from 2,294,718 children under five in 2017 to 3,805,559 in 2018, so the malnutrition rates for 2015 to 2017 (and 2008 to 2017 in the full-series check) use approximate back-cast values of about 3.8 million instead.
Lab notes
-
I assembled births and under-five deaths for 2008 to 2024 from DANE vital statistics, plus the government's preliminary 2025 figure, then built a standardized rate with the denominator fixed at 2008 births, a chart of 2025 scenarios and a notebook that walks through the whole argument.
-
I ran a joinpoint analysis of under-five deaths from malnutrition, 2015 to 2024, with a Monte Carlo permutation test to choose the number of trend breaks.