 Johnattan's Laboratory
What ten million health complaints say about Colombia's health system
Colombia's health regulator publishes its complaint data one month at a time, in workbooks whose layout keeps changing. I rebuilt the full record from 2014 to 2026, loaded 10.2 million individual complaints into one database, and tested whether government takeovers of insurers changed the complaint trend.

Updated19 Jun 2026
The problem
Colombia's Superintendencia Nacional de Salud (Supersalud, the national health regulator) registers every PQRD: peticiones, quejas, reclamos y denuncias, the complaints and information requests people file about their health care. I wanted the long series: how many complaints there are, what they are about, and whether the government's takeovers of health insurers (EPS, the entidades promotoras de salud that run the insurance system) changed anything.
What was out there
The regulator's public page shows only the current month's report. Each workbook is cumulative for its year, the files come in three different layouts between 2014 and 2026, and the most complete 2019 file covers only January to May. The rate column in the official tables changes scale from year to year, so it cannot be compared. The complaint reasons were reclassified in July 2023, from six top-level categories to four. Record-level data exist on a separate ArcGIS portal, as 12 large CSV files in two schema generations.
What I built
Two independent data sources, checked against each other. The first is a tidy monthly series of the published tables from 2014 to 2026, with 11 breakdowns: type, risk level, channel, department, department capital, reason, insurer by regime and other supervised entities. The second is a DuckDB warehouse of 10,246,947 individual complaints from 2017 to 2025, with demographics, municipality codes and ICD-10 diagnosis codes. On top of them sit a reason crosswalk, an event study of the insurer takeovers and a set of charts in Spanish.
Equipment
- Claude Code Harnesses and agents
- Codex CLI Harnesses and agents
- GPT (GPT-5.5 to GPT-6.1 in Codex) AI models
- Antigravity CLI (Agy) Harnesses and agents
- Python and uv Code and infrastructure
- DuckDB Code and infrastructure
- Supersalud PQRD data Data sources
How I built it
- Pulled the full archive through the public SharePoint search API behind the regulator's page (130 statistical workbooks) and kept the latest file of each year, which holds the whole year.
- Wrote a parser that finds the month-header rows and maps the 11 tables by position across three format eras (2014 to 2018, 2019 to 2021, 2022 to 2026), with a separate template for 2023, the year the reasons were split.
- Downloaded the 12 record-level files (about 5.9 GB of CSV) from the regulator's ArcGIS open data portal and loaded them into DuckDB, unifying two schema generations and different delimiters.
- Mapped old and new reason categories onto stable themes, and tested the share of each theme at the July 2023 boundary.
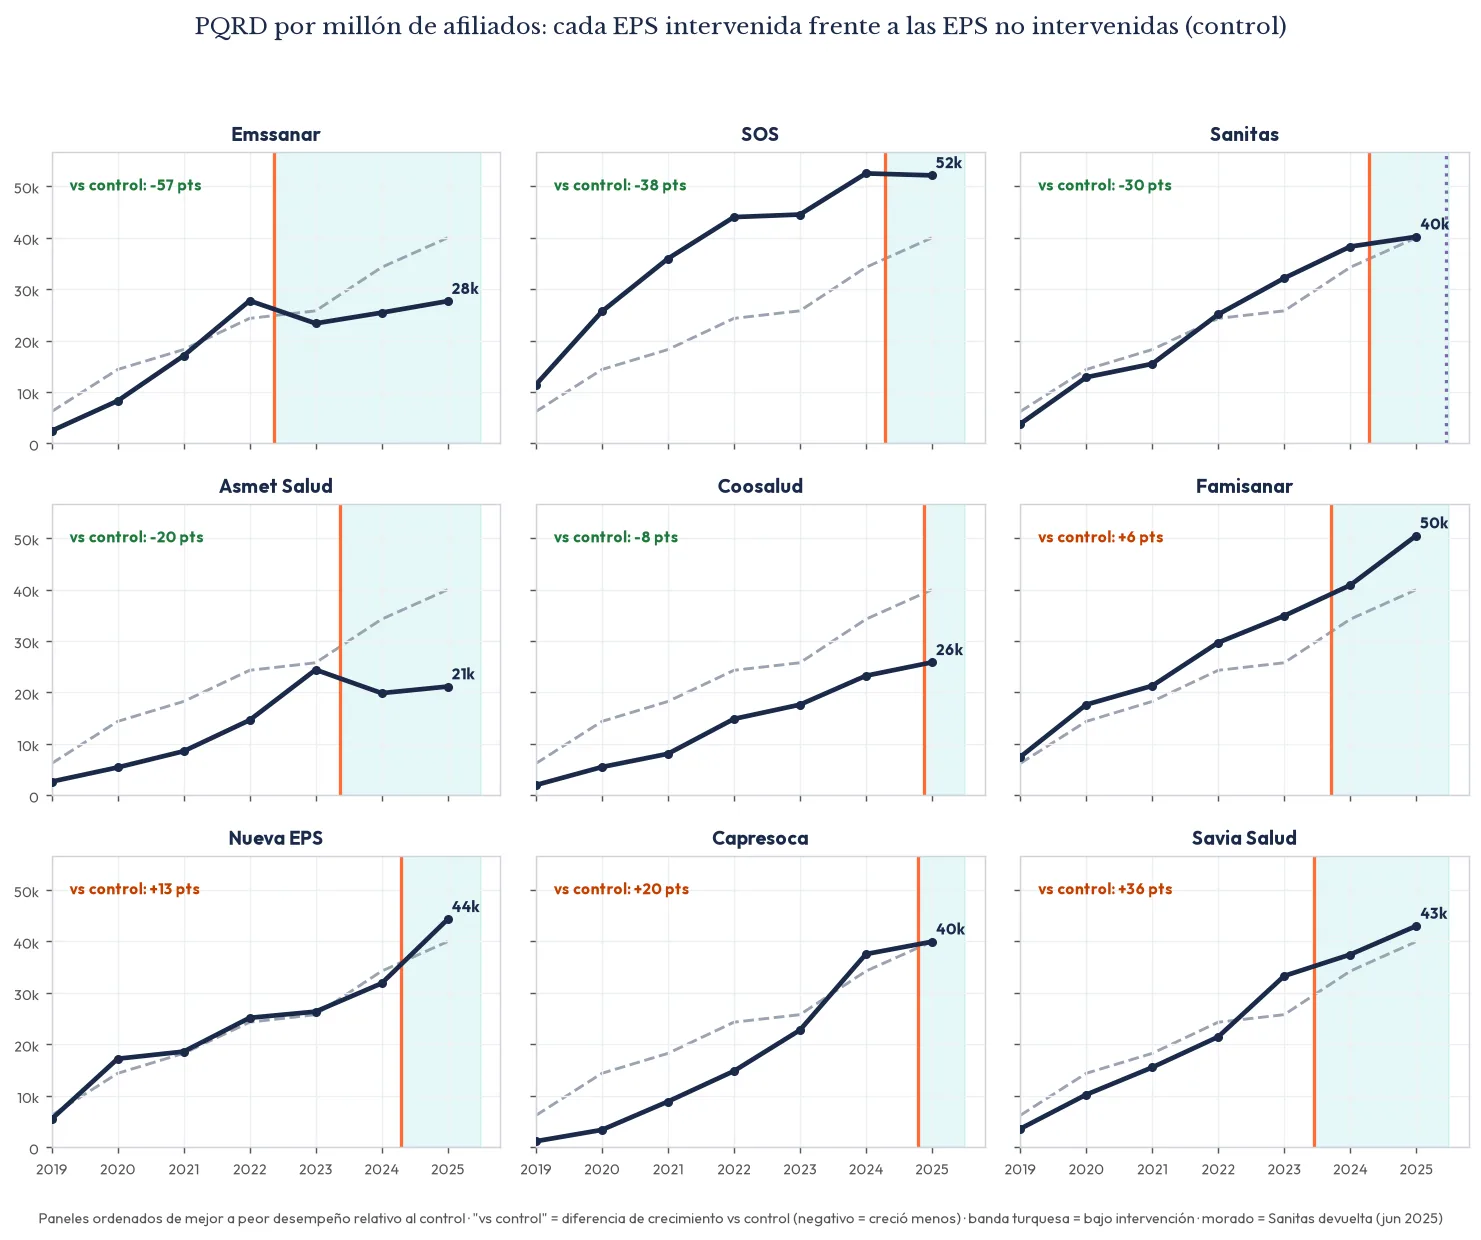
- Recomputed complaint rates from counts and affiliates, then aligned each intervened insurer to its own takeover date and compared it with never-intervened insurers over the same years.
- Had Codex and Agy research the takeover dates independently and critique the charts; both agreed on every date.
Results
- The microdata match the published totals exactly, month by month, in every full year checked (2017 and 2022 to 2025).
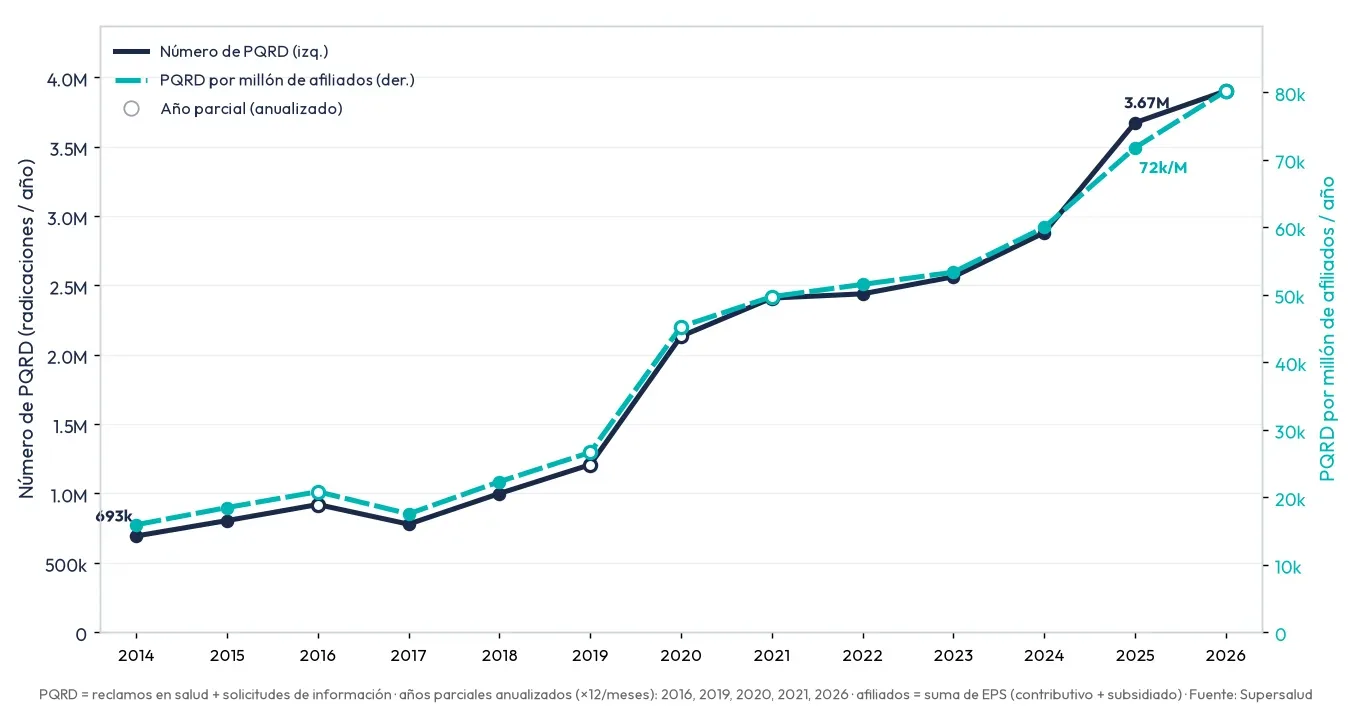
- PQRD (complaints plus information requests) rose 5.3 times, from 692,997 in 2014 to 3,673,605 in 2025, and 4.5 times per million insurance affiliates.
- Access barriers (care that is delayed or denied) rose from 79.1% of complaints in 2017 to 92.5% in 2025.
- With the classification held constant, access complaints were 83.2% of the total from August 2018 to July 2022 and 87.2% from August 2022 to June 2023, after the change of government. At the July 2023 reclassification the share moved from 89.4% to 89.5%, so the rise is not an artifact of the new categories.
- Of nine intervened insurers, five saw complaint rates grow more slowly than never-intervened insurers after their own takeover and four grew faster. Nueva EPS, the largest (11.7 million affiliates in 2025), went from 264 to 443 complaints per 10,000 affiliates: a 68% rise, 13 percentage points more than the control's 55%.
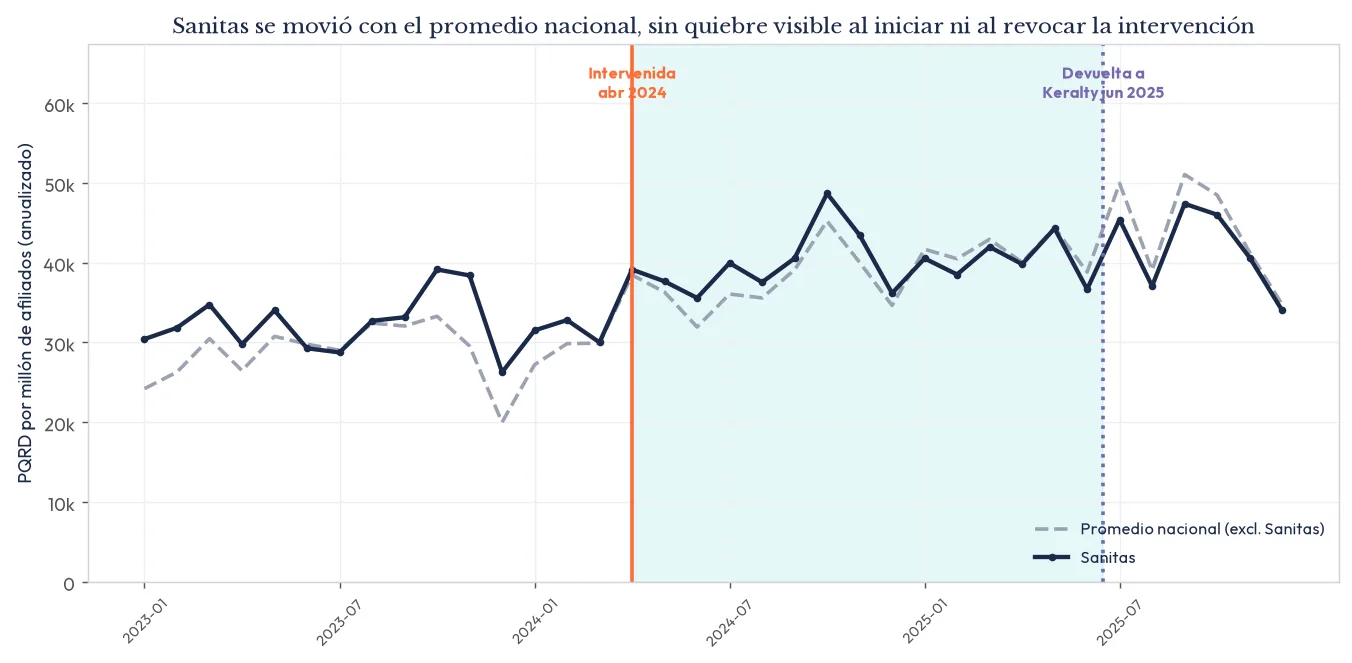
- Sanitas was taken over in April 2024 and returned to private control by the Constitutional Court in June 2025. Its share of national complaints was 13.2% before, 12.7% during and 12.1% after the takeover, with no level shift at either switch.
What I learned
Never trust a published rate whose scale moves between years. Recompute it from the counts and the denominators.
Staggered events need a staggered design. A first cut that lumped the two April 2024 takeovers into one before-and-after comparison said the interventions made complaints worse. Aligning each insurer to its own date showed a mixed result, driven by one very large insurer.
When a classification changes, check the boundary before reading a trend across it. Here the access share barely moved at the break (89.4% to 89.5%), which is what made the cross-era comparison defensible.
Lab notes
-
I replaced a single before-and-after cut with an event study that aligns each intervened insurer to its own takeover date. Codex and Agy checked the dates independently and critiqued the charts, and I revised them.
-
I mapped the old and new complaint reasons onto stable themes across the July 2023 reclassification, and drew the foundational chart of complaints per million affiliates, 2014 to 2026.
-
I found the full complaint archive behind the Supersalud page through its public search API, parsed one workbook per year from 2014 to 2026, and loaded 10,246,947 record-level complaints into a DuckDB warehouse that matches the published monthly totals.