 Johnattan's Laboratory
Insured but not served: what Colombia's quality-of-life survey shows about access to care
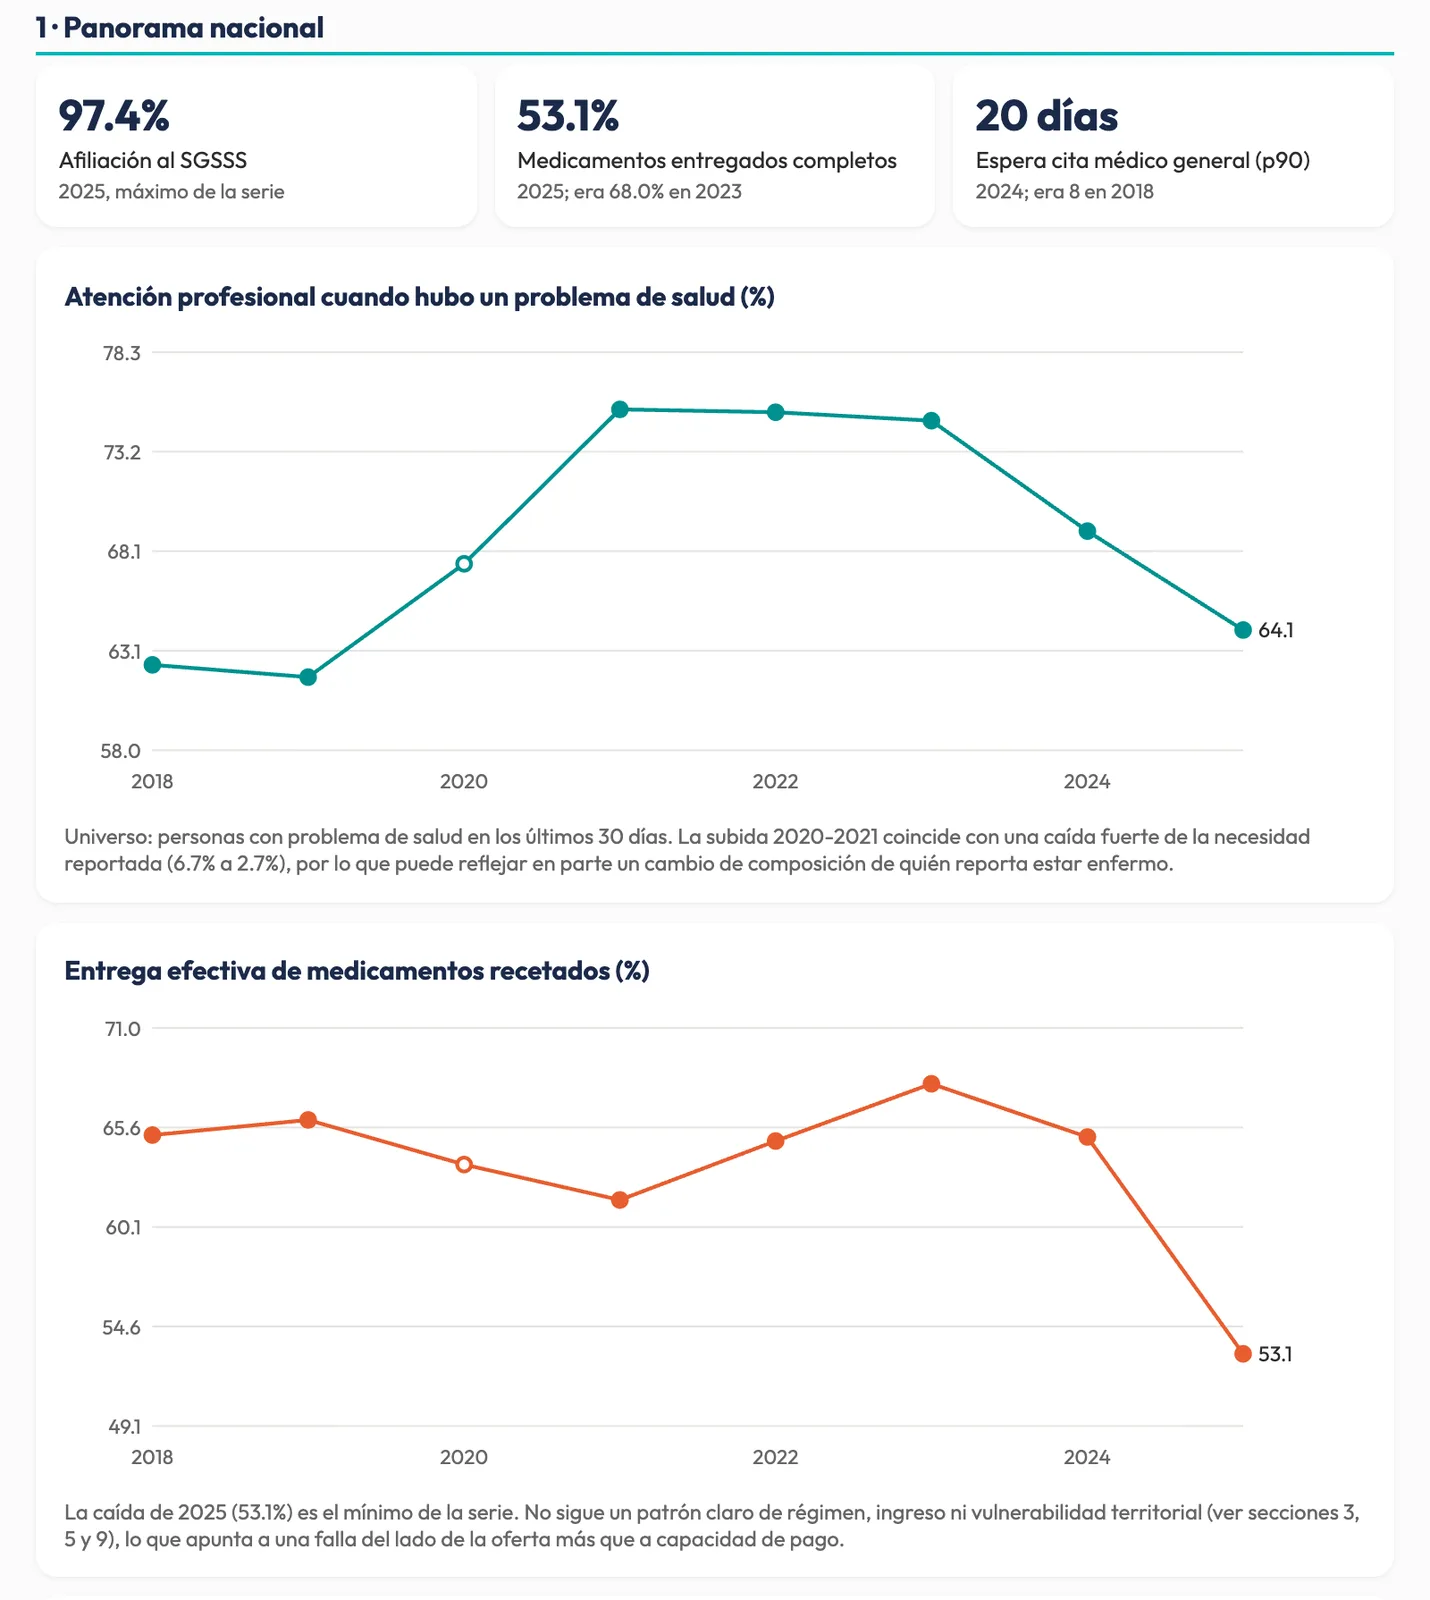
Health insurance in Colombia reached a record 97.4% of people in 2025. I built a weighted 2018 to 2025 health series from the national quality-of-life survey microdata to see whether that coverage turns into care, and found that access fell while coverage rose.

Updated10 Aug 2026
The problem
On paper, Colombia's health system covers almost everyone. I wanted to know whether that coverage turns into effective access: whether sick people get seen, whether they get the medicines they are prescribed, and who is left behind. The best public source is the health module of the Encuesta Nacional de Calidad de Vida (ECV, the national quality-of-life survey run by DANE, Colombia's statistics agency), with about 230,000 people per round.
What was out there
DANE publishes each round as separate chapter files with open microdata, but the formats, weights and questions shift from round to round. The 2017 round is urban only, the 2018 redesign quadrupled the sample, the 2020 round was partly by telephone because of COVID, and several questions changed wording or routing. The survey records the insurance regime but never the specific insurer.
What I built
I built a reproducible pipeline that goes from DANE's raw files to a weighted, design-based series of health indicators for 2018 to 2025, broken down by insurance regime, income quintile, ethnicity, age, sex, rural or urban residence and department. The results sit in one self-contained report in Spanish with ten sections: the national picture, the care cascade, chronic patients, regimes, inequality gradients, childhood, out-of-pocket spending, health behaviors, territory and methods.

Equipment
- Claude Code Harnesses and agents
- Claude (Opus 4.6 to 5.5) AI models
- Codex CLI Harnesses and agents
- GPT (GPT-5.5 to GPT-6.1 in Codex) AI models
- Python and uv Code and infrastructure
- R survey package Code and infrastructure
- DANE Data sources
How I built it
- Scraped each round's catalog page on DANE's microdata portal and downloaded the health-relevant chapters for ten rounds, 2016 to 2025 (about 1.6 GB), then converted them to parquet, handling stray byte-order marks, comma decimals and Deflate64 zip files.
- Pulled the full question dictionary for the health chapter in all ten rounds and flagged wording changes (102 of 184 variables), so each series is trended only where the question stayed the same.
- Weighted every estimate with DANE's expansion factors (the recalibrated census-based factors for 2017 and 2018) and computed confidence intervals from the real sample design from 2022 on. Department cells with fewer than 60 cases are suppressed.
- Added inequality measures (slope index of inequality) with 250-replicate bootstrap standard errors, and age and sex standardization for regime and department comparisons.
- Checked the work three ways: Codex (GPT-5.6 Sol) audited the code and then every claim in the prose, R's survey package rebuilt 64 estimates from the raw questionnaire items, and Claude Opus reviewed the insights brief.
Results
- Insurance affiliation rose from 93.9% in 2018 to 97.4% in 2025, the series maximum.
- Among people with a recent health problem, the share who got care from a doctor or health institution fell from 74.8% in 2023 to 64.1% in 2025.
- Full delivery of prescribed medicines fell from 68.0% to 53.1% over the same two years, the series minimum. For chronic patients it fell from 66.8% in 2024 to 50.7% in 2025.
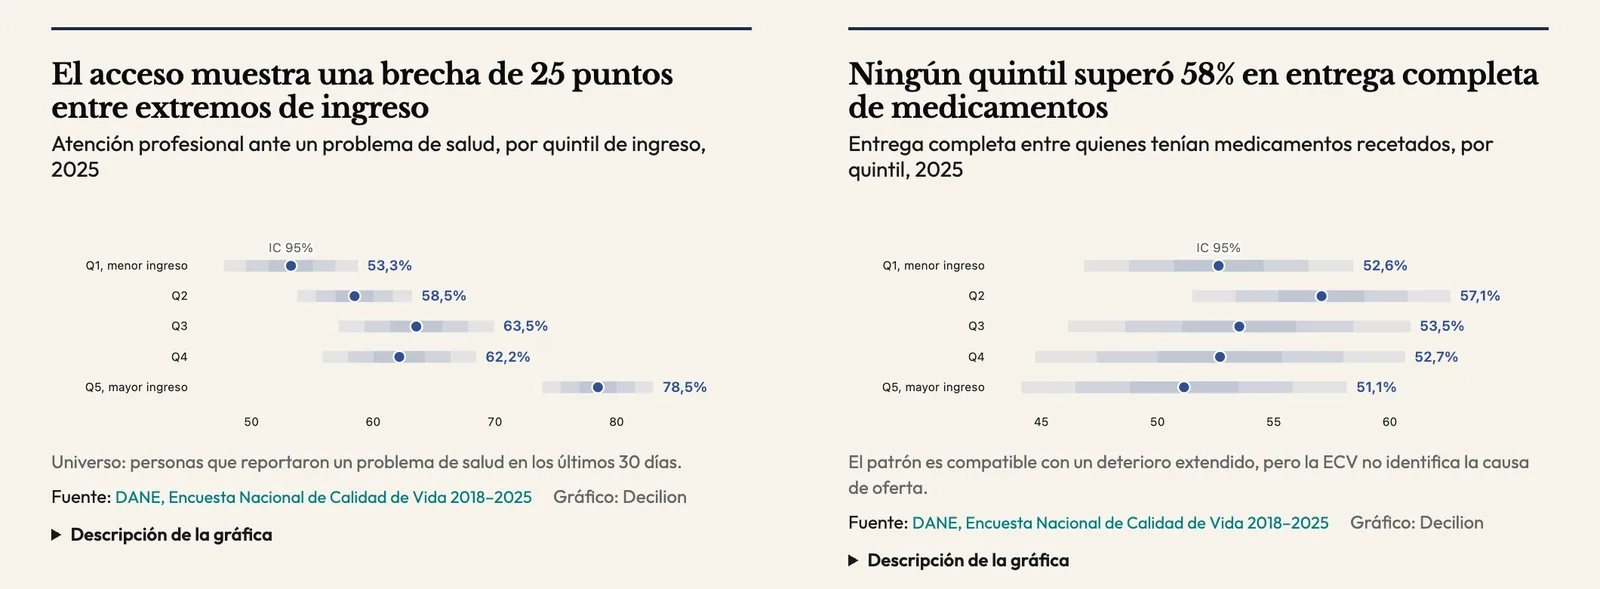
- In 2025, 53.3% of people in the poorest income fifth got care when sick, against 78.5% in the richest, a gap of 25.2 points. Medicine delivery showed no detectable gradient by income: its slope index of inequality was not distinguishable from zero.
- Down the protection ladder in 2025, care when sick went from 83.9% for people with prepaid plans to 72.8% in the contributory regime, 56.5% in the subsidized regime and 43.0% for the uninsured (the two ends rest on small samples).
- Dentistry was 34% of household out-of-pocket health spending in 2025, and medicines 24%.
- After the fix to subgroup variance, 64 of 64 point estimates, standard errors and denominators matched R's survey package; the largest difference in an estimate was 0.0049 percentage points.
What I learned
A code audit does not check the prose. The first Codex audit passed the code; the second checked each sentence against the data and found wrong figures in the text, such as indigenous care-seeking written as about 52% when the data say 45.8%.
If you write your own survey estimator, check it against a reference implementation. Comparing with R showed that my subgroup standard errors were understated by up to 9.8%, because filtering to a subgroup dropped every sampling cluster with no cases in it. The point estimates did not change, and no published claim broke under the wider intervals.
Read the questionnaire, not only the variable list. A chronic-illness question gained a 12-month reference period in 2023, which produced an apparent drop from 16% to 12% that is not real, and a change in prenatal routing in 2021 makes earlier prenatal levels incomparable.
Lab notes
-
I added a short insights brief with six chart specifications, and Claude Opus checked every number and interpretation in it.
-
Codex audited the code and then every claim in the report against the data, and I corrected the figures and wording it found overstated. Checking my estimator against R's survey package showed subgroup standard errors that were too small; after the fix, 64 of 64 estimates matched.
-
With Claude Code I built the pipeline: ten survey rounds downloaded from DANE's microdata portal, converted to parquet and turned into weighted indicators and a ten-section report.