 Johnattan's Laboratory
Building a chord graph of world pharmaceutical trade
I wanted one picture of who sells medicines to whom, by money and by weight. So I pulled every export-reported flow from UN Comtrade, drew it as a chord graph in code, and tried editing the layout by hand in Paper through its MCP.

Updated8 Jun 2026
The problem
I wanted one picture of world pharmaceutical trade: which countries sell medicines to which, how much of it rich countries control, and how different the picture looks by money and by physical weight. A chord graph fits that question, since every country is an arc on a circle and every ribbon is a flow between two of them. Getting there needed a clean country-to-country matrix and a poster good enough to publish. Then I hit a second problem: adjusting the poster layout by asking an AI to guess pixel offsets in code was slow and imprecise.
What I built
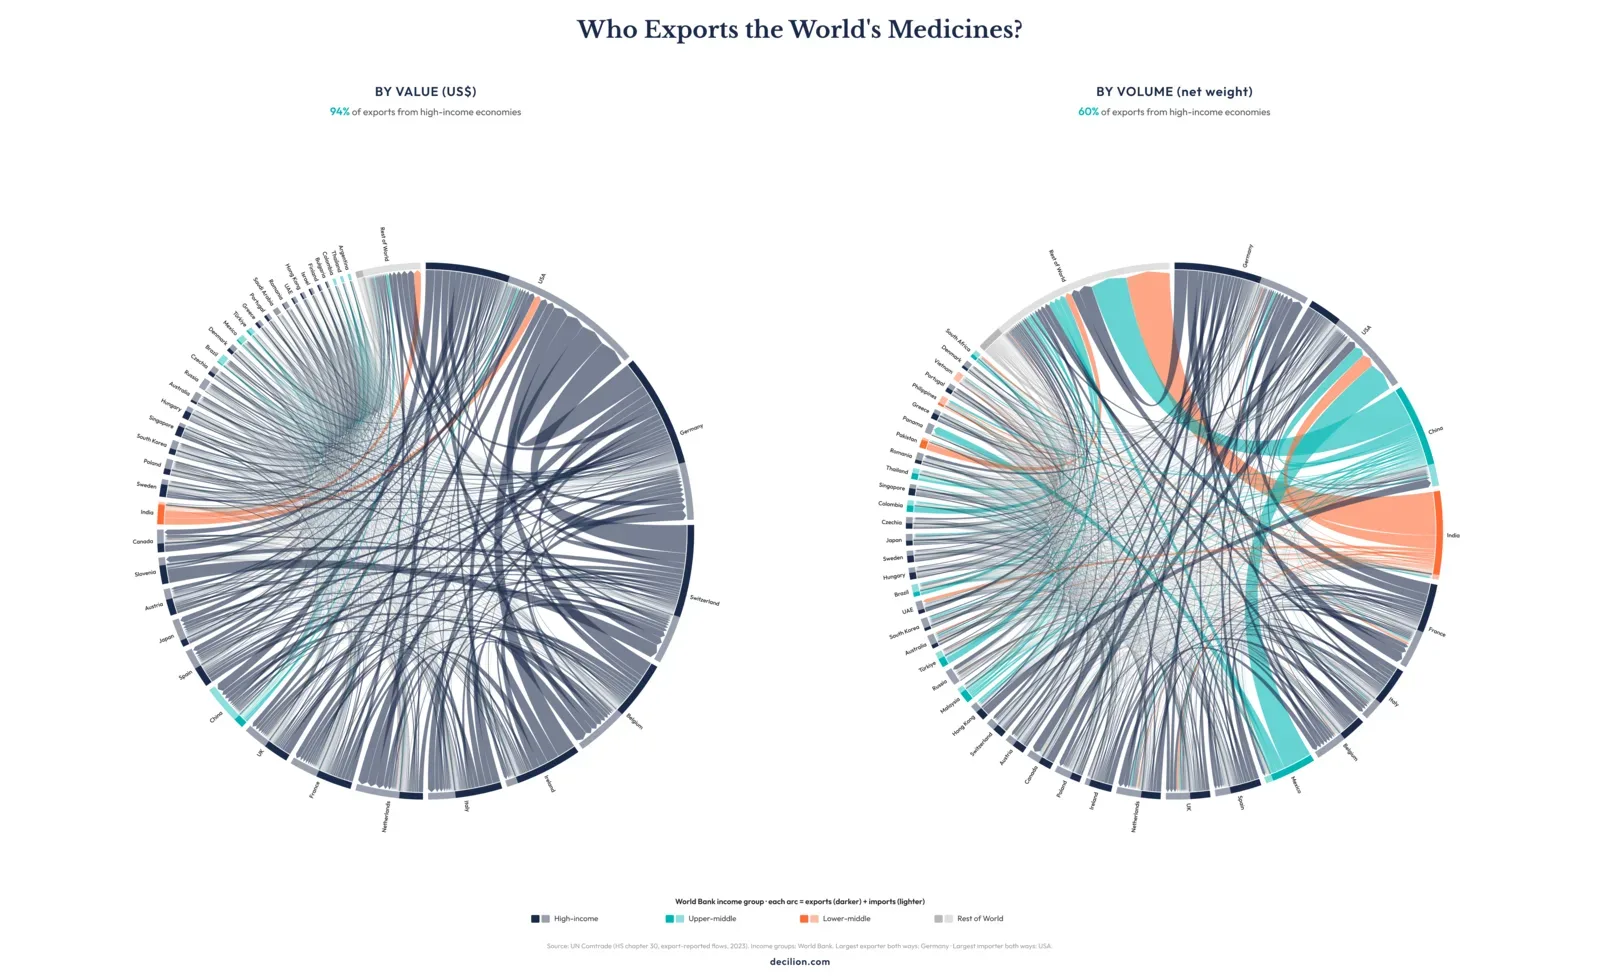
A pipeline that turns UN Comtrade bilateral trade data into chord graph posters, by value (US dollars) and by volume (net weight in kilograms), as self-contained SVG files with embedded fonts and PNG images of 4,000 to 5,000 pixels. Countries are coloured by World Bank income group. Ribbons are arrows that point at the importer, and each country's arc is split into a darker export band and a lighter import band. I also built a way to edit the finished poster by hand in Paper, a design tool, and read the exact positions back into the code.
Equipment
- UN Comtrade Data sources
- Python and uv Code and infrastructure
- Node.js Code and infrastructure
- D3 Design and media
- resvg-js Design and media
- Paper Design and media
- Paper MCP MCP servers
- Claude Code Harnesses and agents
- Claude (Opus 4.6 to 5.5) AI models
How I built it
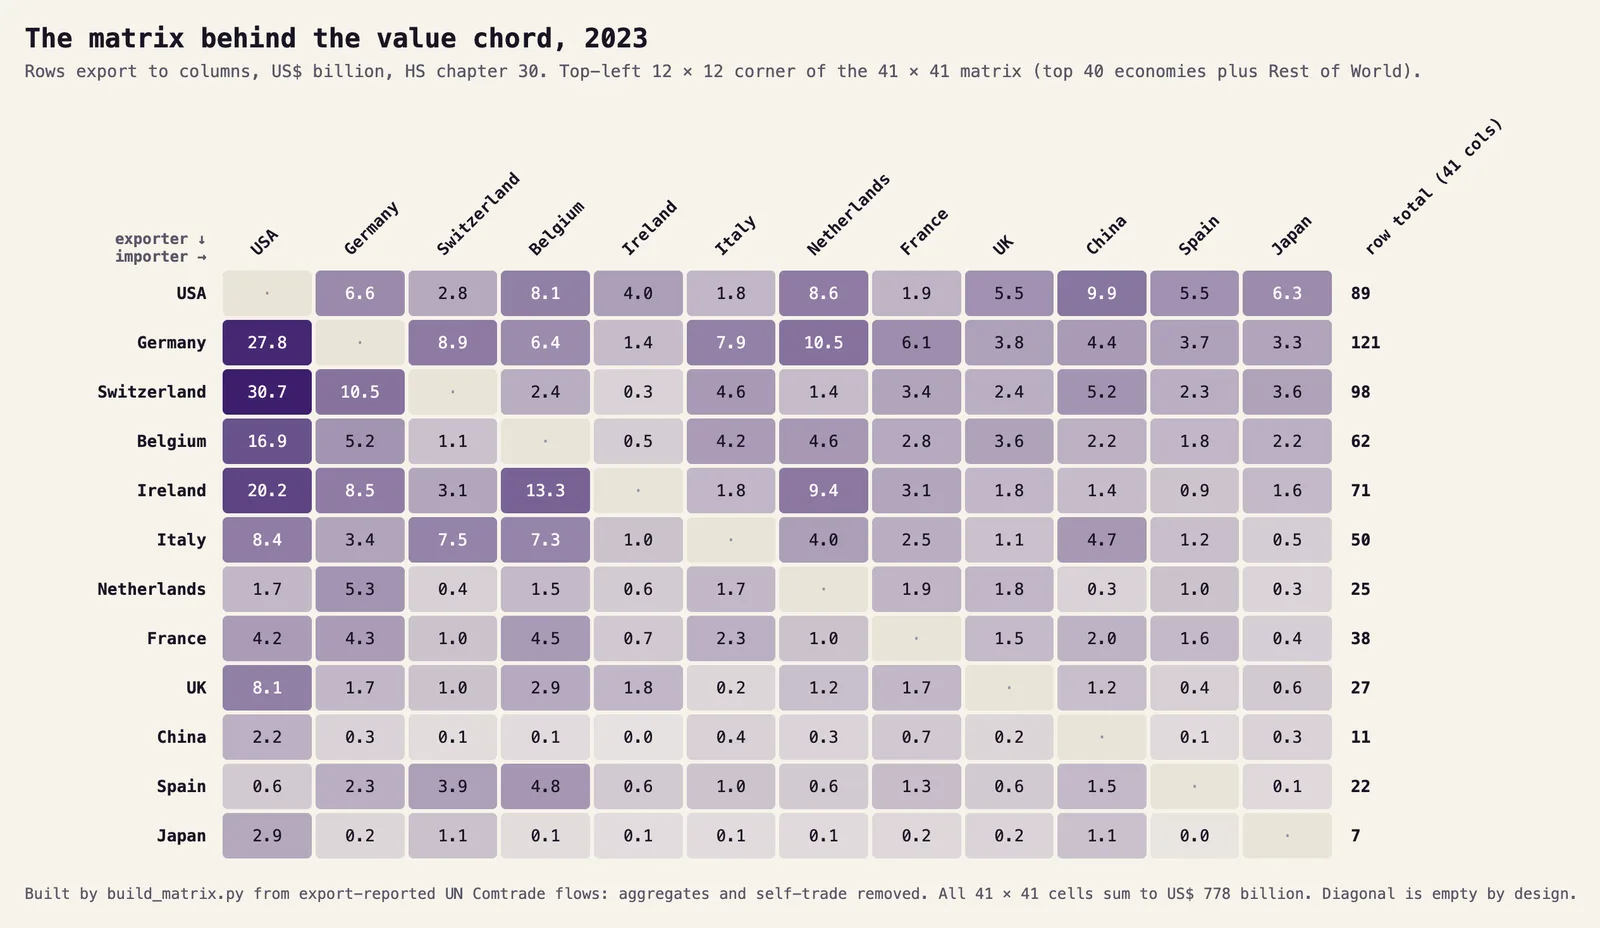
- Pulled only export-reported flows for 2023 from the Comtrade API, for all 255 reporters, so each flow from one country to another is counted once. For volume I requested the 44 chapter 30 codes at the 6-digit level, in chunks of 8 reporters to stay under the API's response cap, and summed weight and value for each pair of countries.
- Built a directed matrix in Python: removed World, regional blocs and self-trade, ranked countries by exports plus imports, kept the top 40 and folded the rest into "Rest of World".
- Drew the graph with D3's directed chord layout in Node, wrote the corner text (title, legend, a headline figure, source note) with figures computed from the matrix, never typed by hand, and rasterised it with resvg. I rejected a colour gradient for exports and imports, since a flow is one or the other, so the arcs use two solid shades.
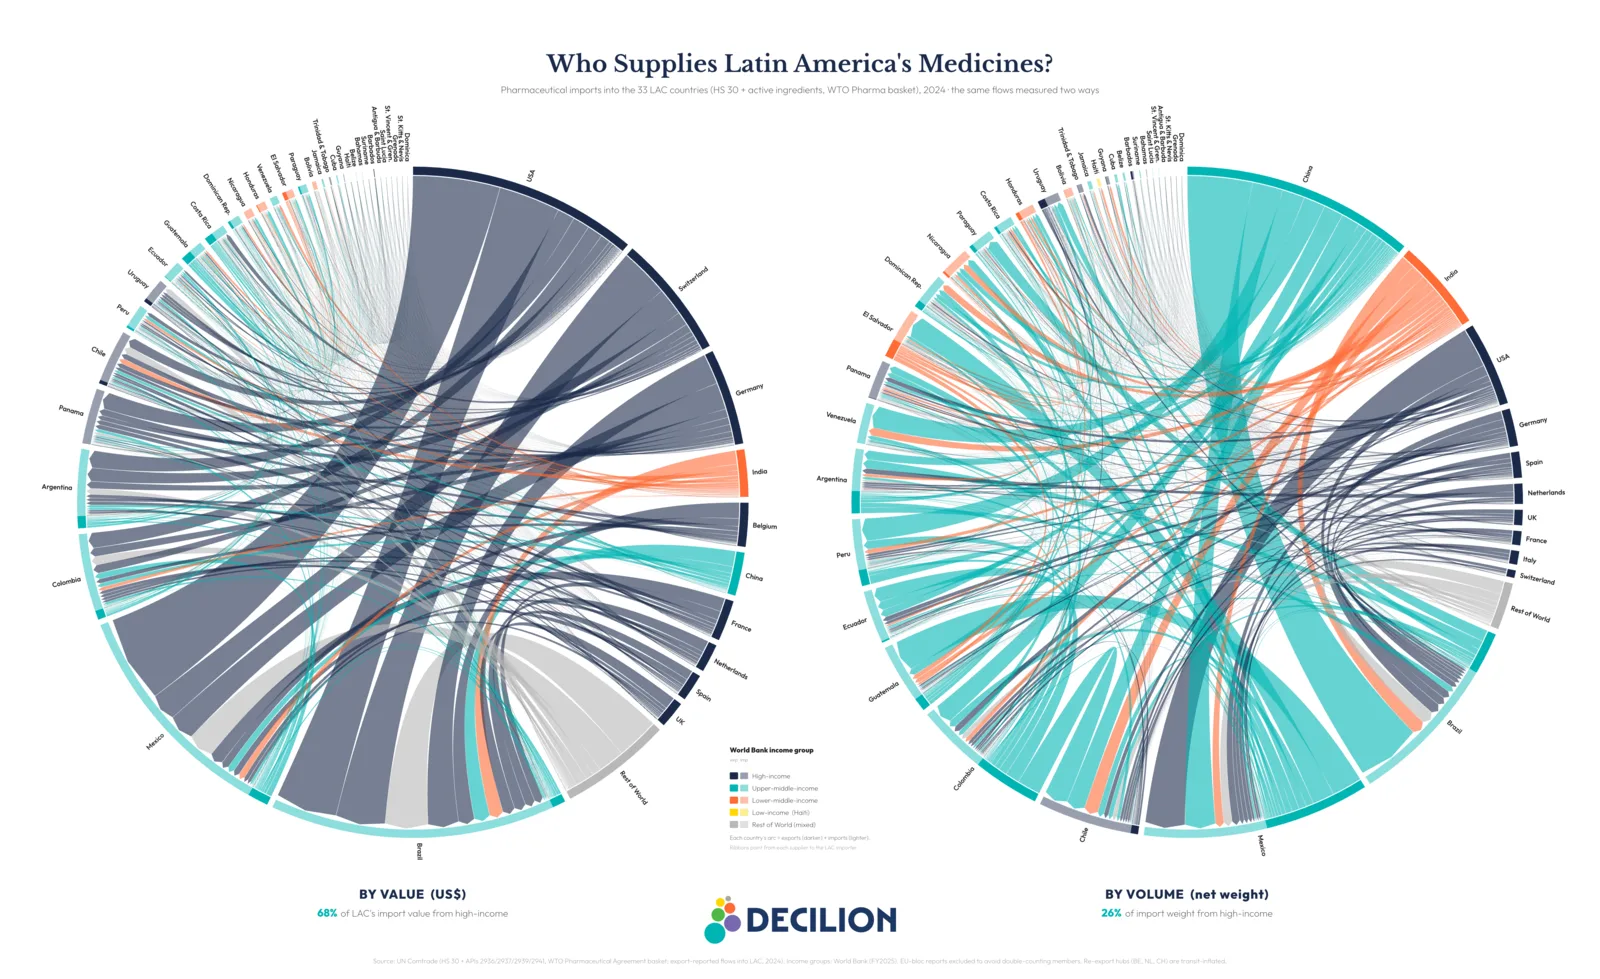
- Repeated the pipeline for the WTO Pharmaceutical Agreement basket (88 product codes: chapter 30 plus active ingredients), and for imports into the 33 Latin American and Caribbean countries from their top 10 outside suppliers.
- For the Paper experiment, cut the ring out of the SVG, rounded its coordinates to one decimal, embedded the label font, and loaded it into Paper by file path. Then I rebuilt the corner blocks as native Paper text and shapes on an artboard the same size as the original, so positions map one to one.
- I moved and restyled blocks in Paper; Claude read the exact positions and styles through the Paper MCP and ported them back into the generator, so every variant and future year renders with the new layout.
Results
- By value, 94% of the exports in the top-40 graph come from high-income economies, and the top 40 cover 94.8% of world pharmaceutical trade.
- By volume, only 60% comes from high-income economies, and the top 40 cover 83%.
- Ranked by total trade, Switzerland is 3rd by value and 16th by volume, Ireland 5th and 12th, and India 16th and 4th. Germany is the largest exporter and the United States the largest importer both ways.
- With active ingredients added, the high-income share falls to 93% by value and 58% by volume, and China becomes the largest trader by volume.
- Net weight was available for 97% of the 10,744 country pairs.
- For Latin America and the Caribbean, high-income countries supply 68% of imports by value but 26% by weight in 2024 (68% and 25% in 2023).
- The value poster SVG has 1,637 paths and weighs about 870 KB. Rounding coordinates cut the ring's path data from about 494 KB to about 293 KB with no visible change.
What I learned
Comtrade only reports net weight at the 6-digit product level. Asking for chapter 30 as a whole returns a weight of zero, so a volume graph has to be built from the individual product codes.
Rasterise with resvg, not sharp: sharp uses librsvg, which does not reliably render custom embedded fonts. resvg, given the font files directly, does.
The Paper round trip works for layout, with three caveats: Claude sees changes only when asked to look; Paper places text by the top-left of its box while the generator uses the baseline, so text needs an offset of about 0.8 times the font size; and rounding coordinates to whole numbers turns the 0.25-pixel strokes into zero and erases the ribbon outlines, so round to one decimal.
Lab notes
-
I rebuilt the value poster in Paper, with the chord ring as one imported image and the text blocks as native, draggable elements. I also built a version on who supplies Latin America and the Caribbean, and rebuilt it on 2024 data.
-
I added a variant on the WTO Pharmaceutical Agreement basket, which adds active ingredients to finished medicines.
-
I pulled every export-reported chapter 30 flow for 2023 from UN Comtrade, drew the first chord graph by value, then added a volume version by net weight (pulled at the 6-digit product level) and a side-by-side poster of value against volume.