 Johnattan's Laboratory
What public data show about Medicare's first negotiated drug prices
The first ten negotiated Medicare drug prices took effect on 2026-01-01, and my scoping scan found no published study measuring what moved across all ten. I measured it from public CMS files.
Updated21 Oct 2026
The problem
I wanted to learn to work with US public health data by answering a real question with it. The first ten Maximum Fair Prices (MFPs) negotiated under the Inflation Reduction Act took effect for Medicare Part D on 2026-01-01. What actually changed, in spending, list prices, pharmacy costs and plan prices?
What was out there
A literature and grey-literature scan found no published measure of realized 2026 spending across the ten drugs. The closest, Castle et al. 2026 in JAMA Network Open, covers Stelara and its biosimilars. It also found no weekly series comparing pharmacy acquisition cost with the MFP drug by drug, and the January list-price cuts were documented only in grey literature (NCPA, 46brooklyn, Drug Channels). Net prices are not public at all: Part D rebates by drug are confidential by statute, and commercial net-price data (IQVIA, Symphony, SSR Health) need paid licenses.
What I built
A study of the first year of Medicare drug price negotiation: four findings, a literature review, a plain-language guide to how Medicare drug pricing works, and a pre-registration of what I expect in 2027, all on one interactive report page. It is one of two tracks in the same public repository; the other is the county atlas.
Equipment
- Claude Code Harnesses and agents
- Claude (Opus 4.6 to 5.5) AI models
- Codex CLI Harnesses and agents
- GPT (GPT-5.5 to GPT-6.1 in Codex) AI models
- Antigravity CLI (Agy) Harnesses and agents
- Gemini (Gemini 4 Argon) AI models
- Python and uv Code and infrastructure
- Playwright Code and infrastructure
- GitHub and GitHub Pages Code and infrastructure
- CMS Medicare data Data sources
- NADAC (Medicaid) Data sources
How I built it
- Mapped the public US drug data (CMS Medicare files, Medicaid's NADAC pharmacy acquisition prices, FDA and others) and checked every source live on 2026-10-20.
- Measured the ten drugs from three angles: gross Part D spending per claim (2025 against the first quarter of 2026), NADAC changes that CMS attributes to list-price (WAC) changes, and weekly NADAC per unit divided by the MFP per unit. Comparison groups: the 15 drugs negotiated for 2027, the 15 selected for 2028, and other brand-name products.
- Checked the Part D plan pricing files directly against the MFP across three releases (each release is about 2.5 GB).
- Wrote down five predictions for the 2027 drugs and committed them before I examined any 2027 outcome data. Later decisions go in dated amendments, and a registered number never changes.
- Had every number replicated from the raw data by Codex (GPT-6 Astra) and the method reviewed by Agy (Gemini 4 Argon), then applied and verified the fixes.
Results
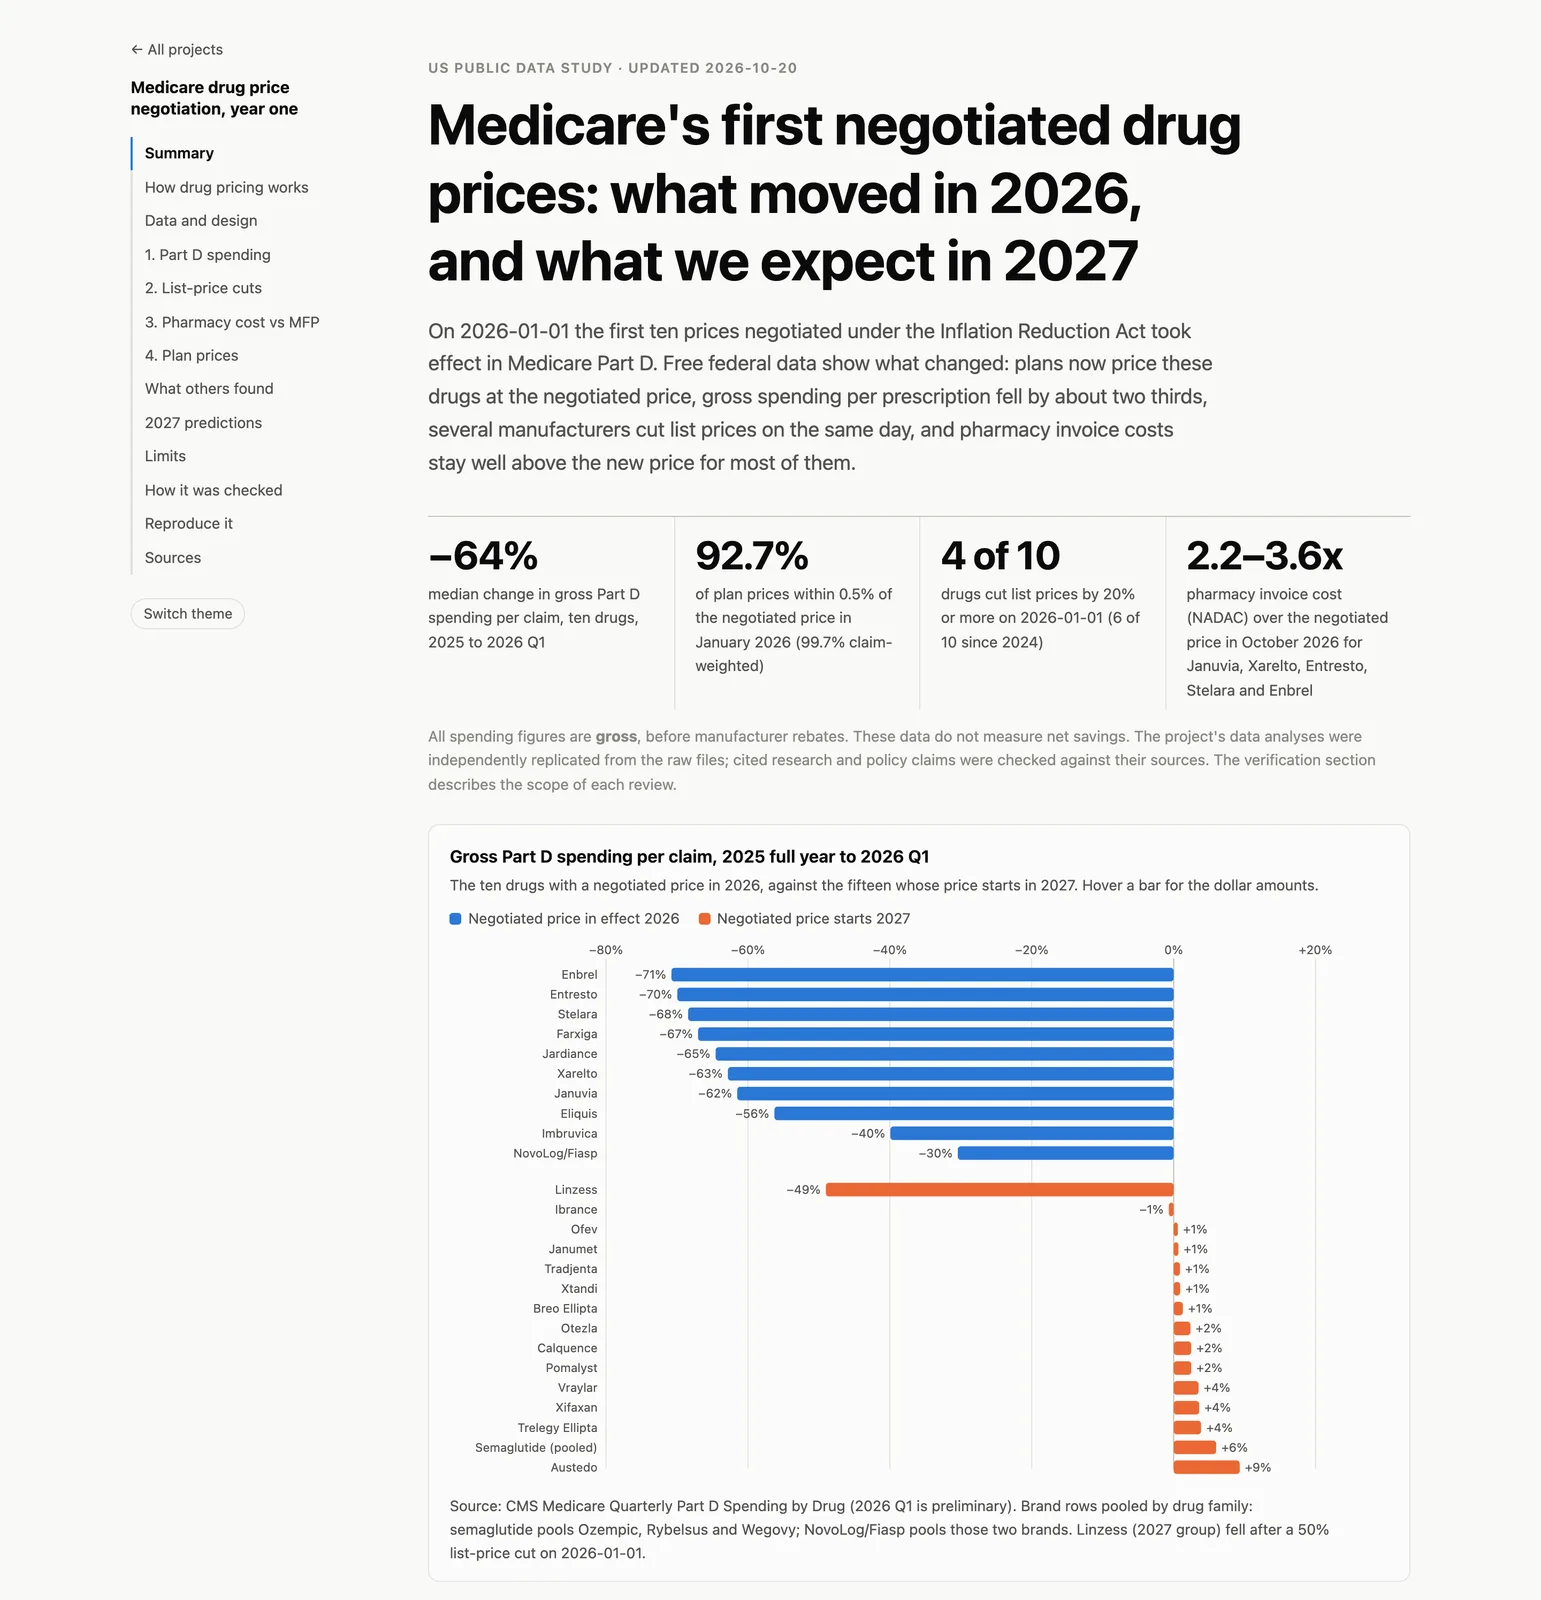
- Gross Part D spending per claim fell for all ten drugs between 2025 and the first quarter of 2026, by a median of 64%, from 30% (the NovoLog entry) to 71% (Enbrel). Holding the 2025 drug mix fixed, the ten fell 61% while the 2027 drugs rose 1.5%, the 2028 drugs 1.2% and 741 other brand-name products 1.1%. These are gross figures, before rebates.
- On 2026-01-01, NADAC recorded list-price cuts of 43% for Eliquis, 44% for Jardiance, 37% for Farxiga and 75% for Fiasp.
- NADAC was 2.2 to 4.0 times the MFP per unit at the end of December 2025 (NovoLog, cut in 2024, was at 1.0). By October 2026 it was 0.99 times for Fiasp, 1.33 for Eliquis, 1.65 for Jardiance and 2.00 for Farxiga, while Januvia (2.70), Entresto (2.22), Xarelto (2.84), Stelara (3.32) and Enbrel (3.57) stayed well above it. This is a gap between an invoice benchmark and the MFP, not a measured pharmacy loss.
- In the plan pricing files, plan unit prices for the ten drugs were a median 2.77 times the MFP in plan year 2025 and 1.000 in January 2026, with 92.7% of plan-product prices within 0.5% of the MFP. In the October 2026 release, 91.3% were within 0.5% and none exceeded it by more than 0.5%.
What I learned
A large gross drop can hide a much smaller net saving. The spending files exclude rebates, and MedPAC reports that rebates cut gross Part D costs for these ten drugs by nearly 45% in 2024; Jeon et al. project only an 8.8% fall in 2026 net spending. So I kept the word "gross" in the first sentence of every finding.
Check what a file holds before trusting its label. CMS labels the January 2026 plan pricing release "2025Q4", but its prices are plan-year 2026: Eliquis 5 mg at a median $4.1451 a tablet, the MFP, against $10.05 in the 2025 file.
Lab notes
-
I split the repository into two matching tracks, drug pricing and the county atlas, and published both on GitHub Pages from a public repository.
-
I added a fourth finding from the Part D plan pricing files (plan prices for the ten drugs sit at the negotiated price from January 2026) and registered five predictions for the 15 drugs whose negotiated prices start on 2027-01-01, in a git commit, before opening any 2027 data.
-
I started a US public health data lab, with a catalog of sources checked live that day and a fetcher for CDC datasets, and measured Part D spending per claim, list-price cuts and pharmacy acquisition costs for the ten negotiated drugs. Codex and Agy each recomputed the numbers blind, and I applied their fixes.