 Johnattan's Laboratory
A US county atlas: measured health outcomes against what demographics predict
CDC PLACES models its county health estimates largely from demographics, so on its own it cannot say whether a county does better or worse than similar ones. I built an atlas that compares measured county outcomes with what demographics predict.

Updated21 Oct 2026
The problem
I wanted to learn to work with US public health data by answering a real question with it. CDC PLACES publishes model-based county estimates for 40 health measures. How much of that is demographics, and how do measured county outcomes compare with what demographics predict?
What was out there
For counties, PLACES is the usual source, but its estimates are modeled from demographics and state survey data. On their own they cannot say whether a county does better or worse than similar counties.
What I built
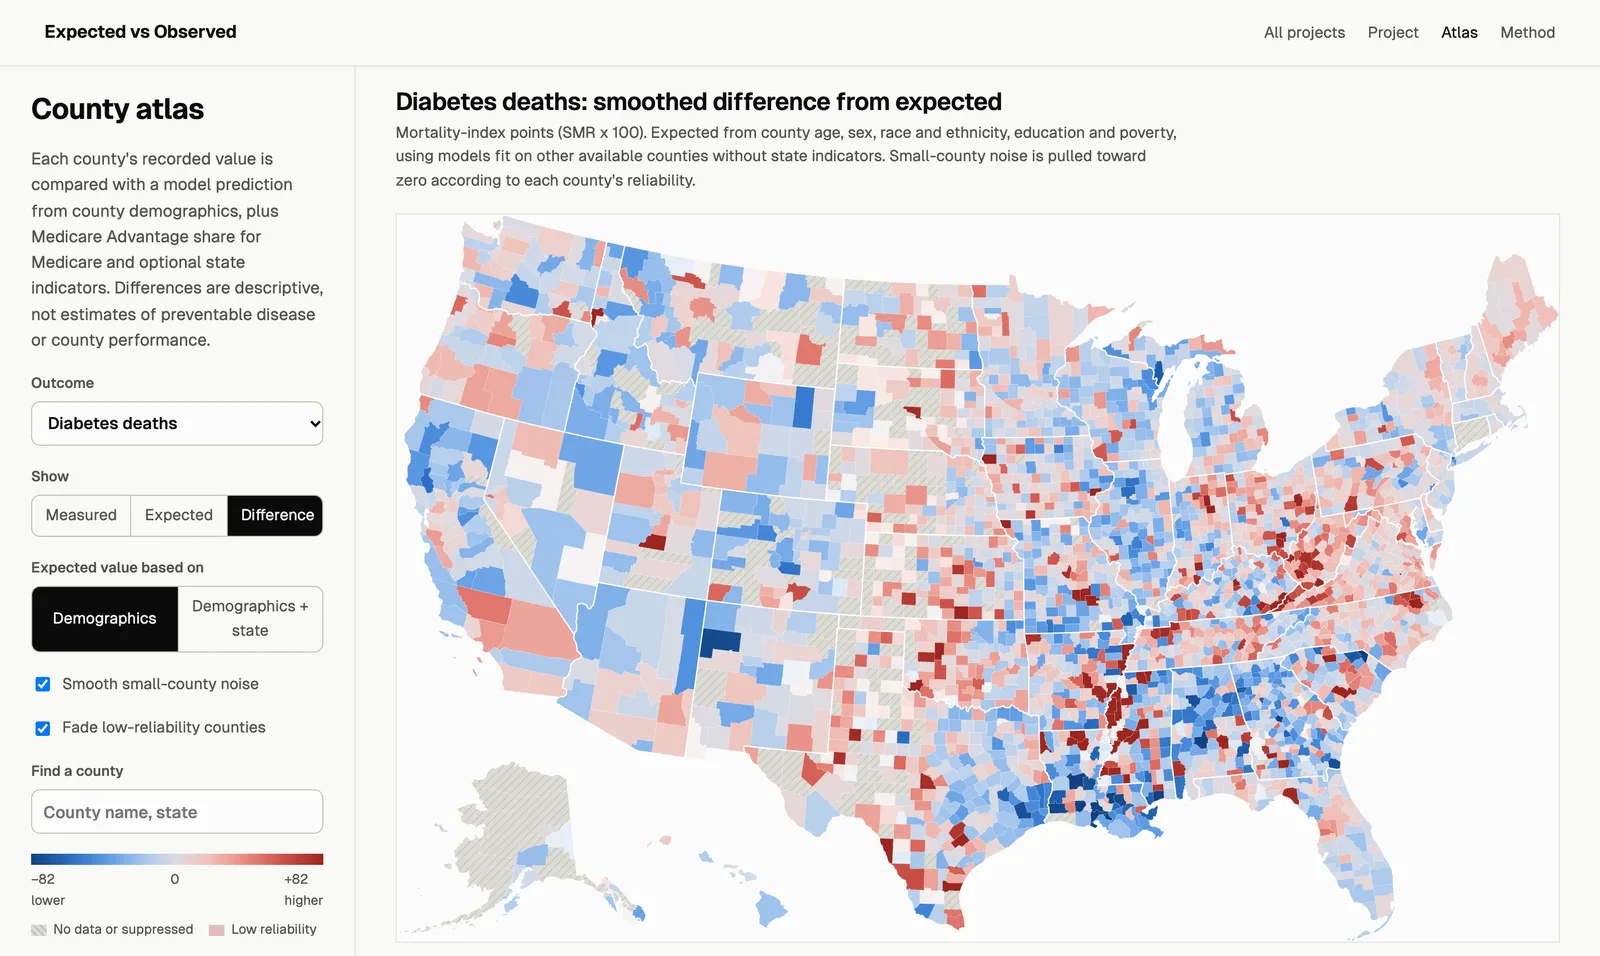
"Expected vs Observed" is a US county atlas. For 34 outcome layers (deaths from CDC WONDER, Medicare claims, Census disability), it compares each county's measured value with a prediction from county demographics, with or without state. It is one of two tracks in the same public repository; the other is the Medicare drug price study.
Equipment
- Claude Code Harnesses and agents
- Claude (Opus 4.6 to 5.5) AI models
- Codex CLI Harnesses and agents
- GPT (GPT-5.5 to GPT-6.1 in Codex) AI models
- Antigravity CLI (Agy) Harnesses and agents
- Gemini (Gemini 4 Argon) AI models
- Python and uv Code and infrastructure
- Playwright Code and infrastructure
- D3 Design and media
- GitHub and GitHub Pages Code and infrastructure
- CDC PLACES Data sources
- CDC WONDER Data sources
- American Community Survey Data sources
- CMS Medicare data Data sources
How I built it
- I gathered the county data: CDC PLACES, deaths from CDC WONDER, Medicare claims conditions and Census disability, with every source checked live on 2026-10-20.
- I predicted each county's value with models fit on other counties, so no county predicts itself, and smoothed small-county noise (empirical Bayes).
- I modeled deaths with a Poisson model and pulled them from CDC WONDER with a headless browser. Under the NCHS data use rules, counts of 9 or fewer, zero included, are never shown.
- Codex (GPT-6 Astra) replicated every number from the raw data and Agy (Gemini 4 Argon) reviewed the method. I applied their fixes and verified them.
Results
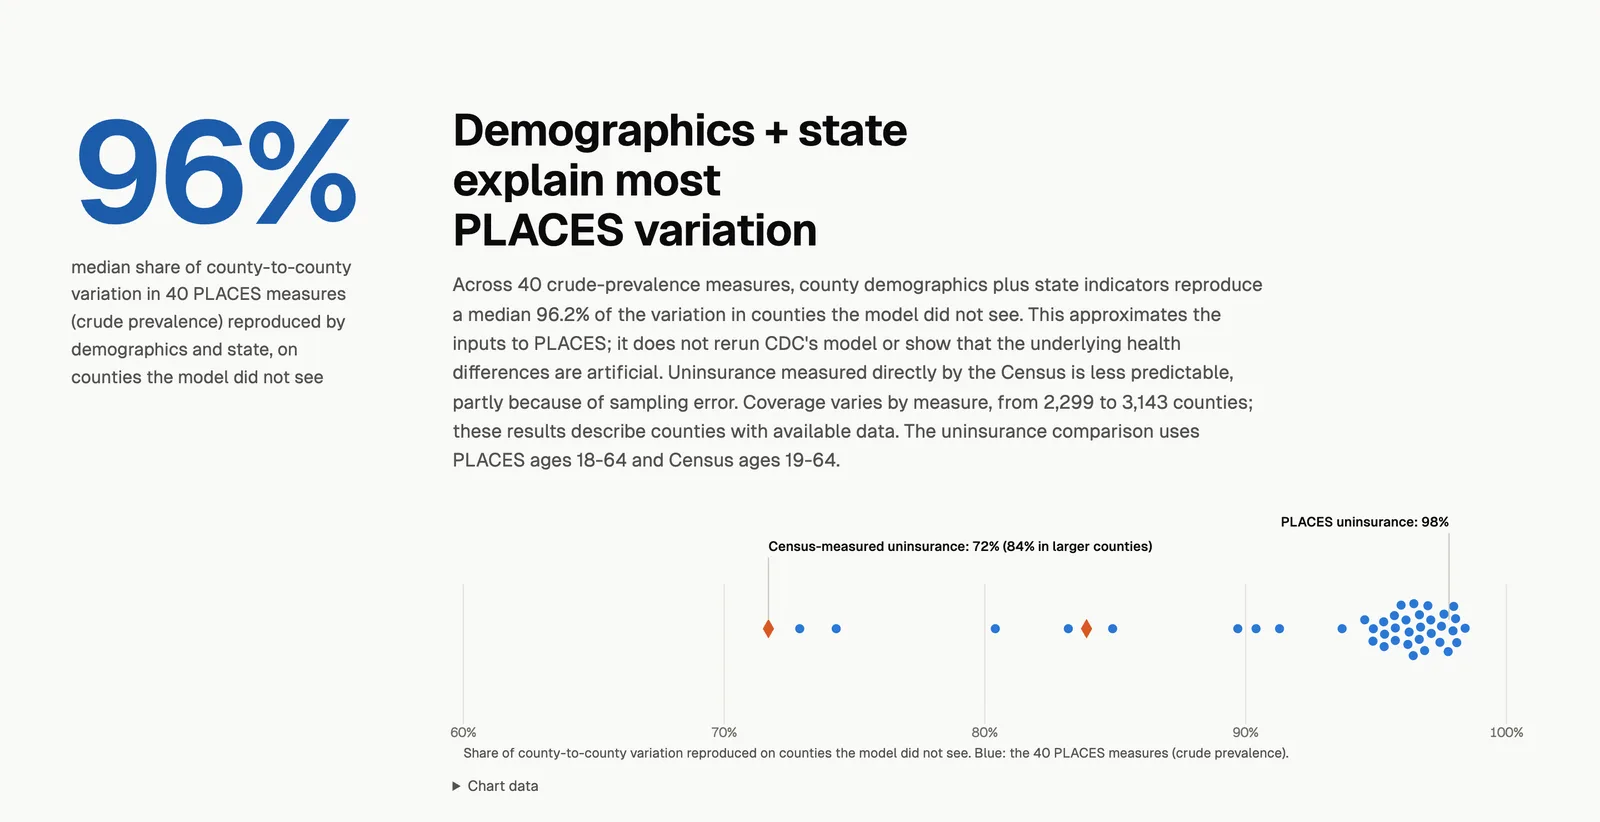
- County demographics plus state reproduce a median 96% (crude prevalence) to 97% (age-adjusted) of the county-to-county variation in the 40 PLACES measures, in counties the model did not see.
- Across 21 measured outcomes (11 Medicare claims conditions, 6 Census disability types, 4 causes of death), adding PLACES to demographics and state improves out-of-sample R² by at most 0.8 percentage points in the full samples and 2.3 in the restricted larger-county samples.
What I learned
Recomputing everything independently found real errors that a single pass missed: counties with zero deaths kept in the data against the CDC rule on counts of 9 or fewer, negative expected death rates in four counties, and correlations between two measures computed on mismatched sets of counties.
Lab notes
-
I split the repository into two matching tracks, re-ran the atlas pipeline and got all 58 outputs back byte for byte, then published both tracks on GitHub Pages from a public repository.
-
I built the county atlas site: a project page and an interactive map with 34 outcome layers, in light and dark mode and with a phone layout.
-
I started a US public health data lab: a catalog of sources, each checked live that day, and a fetcher for CDC datasets.